Performance Logs
GIMP 2.10.8 and above has the ability to record performance logs containing detailed information about the run-time behavior of the program, helping locating and analyzing performance bottlenecks.
This document describes how to record and view performance logs, and how to report performance-related issues.
Recording Performance Logs
Performance logs track the program state while the program is normally running. In the usual case, you would record a performance log while performing a task whose performance you wish to optimize, or against which you wish to report a performance-related bug. The recorded log can then be used to investigate the run-time behavior of the program during the execution of the task.
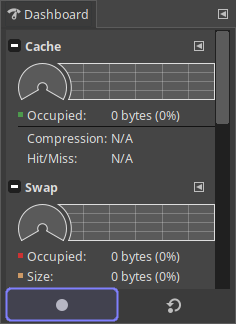
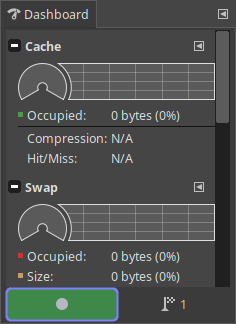
To record a performance log, open the Dashboard dockable (Windows ▸ Dockable Dialogs ▸ Dashboard), click the Record button at the bottom of the dockable, and select a filename for the log. The Record button will subsequently change its color, indicating that the log is being recorded.
At this point, you should perform the task of interest as you normally would, while state information is being recorded. The log contains periodic samples of the program state during execution, and it is therefore important to keep performing the task long enough (possibly repeating it multiple times) so that a sufficiently large number of samples is collected. 30 seconds or more is a good amount of time (longer periods improve the quality of the log, while increasing its size).
When you’re done performing the task, stop recording the log by pressing the Record button again. At this point, GIMP will perform any necessary final steps, which may take a while (usually, no more than a few seconds). At the end of this process, the log is ready.
Note: In situations where you can’t cleanly stop recording the log, such as when GIMP crashes or freezes in the middle of the process, make sure to record a progressive log, as described in section 1.2.
Event Markers
When the recorded task is made up of multiple steps, it is useful to have an indication of where the different steps begin and end within the log. This is achieved using event markers. An event marker is an annotated time-point in the log, signifying the occurrence of an event of interest, such as the beginning or end of a logical step. It is up to you to add event markers to the log, as you see necessary.
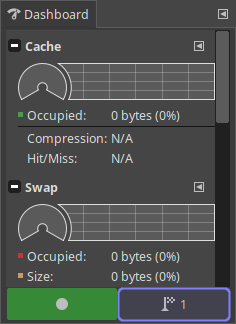
To add an event marker, click the Add Marker button at the bottom of the Dashboard dockable, next to the Record button, and enter a short description for the corresponding event. (Note that the Add Marker button is only available while a log is being recorded.) You may also click the button while holding the Shift key, to add an empty event marker, not containing a description; this is useful when event markers are needed to be added quickly.
Event markers are numbered sequentially, and may be referred to by their number (this is especially useful for empty event markers.) The number of the next event marker (the one that will be added when the button is clicked) is displayed on the Add Marker button.
Log Parameters
When creating a performance log, several parameters can be set at the bottom of the file-selection dialog. There should normally be no reason to change the parameters, unless noted otherwise.

-
Sample Frequency: The number of program-state samples per second. Higher values improve the resolution of the log, while making the recording itself more expensive.
-
Backtrace: Whether or not to include backtraces in the log. Backtraces capture the code-paths taken while recording the log, and should normally be included.
-
Messages: Whether or not to include diagnostic messages in the log. Diagnostic messages indicate errors and unexpected conditions, and should normally be included.
-
Progressive: Whether or not to record a progressive log.
GIMP normally defers certain information to the end of the log, in order to minimize the cost of recording. If the log can’t be cleanly finished—for example, if GIMP crashes or freezes while recording the log—this information will be missing, rendering the log of limited use. In situations like these, a progressive log should be recorded; progressive logs include all relevant information at each sample, allowing them to be terminated at any time.
Progressive logs may incur a higher overhead while recording.
Reporting Performance-Related Issues
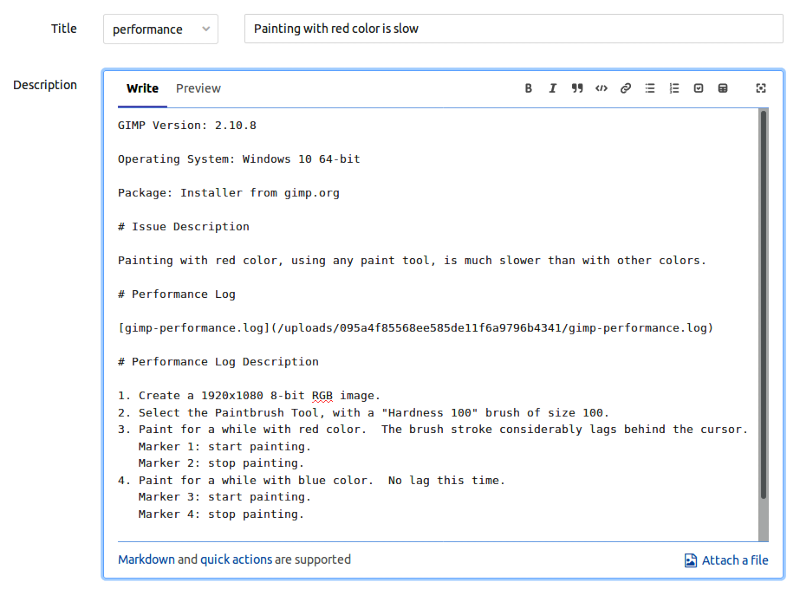
When reporting a performance-related issue, use the performance template in GIMP’s GitLab issue tracker. Provide a detailed description of the task you were performing, and attach a performance log. If the performance log is too big, attach a compressed version. If you’ve added any empty event markers to the log, provide a description for these markers in the report.
Note that the log alone, while containing plenty of low-level information, doesn’t in itself explain what you were doing, nor does it contain all the relevant details, so please do take time to describe the issue in addition to the log. Attaching a screencast of the process, possibly while recording the log, can also be very helpful.
What Information is Contained in the Log?
The log consists mainly of a series of periodic samples of the program state. (The default sampling rate is 10 samples per second; see section 1.2 for a way to modify this value.) Each sample contains the values of all the instrumentation variables displayed in the Dashboard. Additionally, on supported platforms, each sample contains a full program backtrace. (Backtraces are currently supported on Linux and Windows; their level of detail might depend on the available libraries and build-time options.) When debugging information is available, corresponding source-location information is included.
Additionally, the log contains certain global information, not related to any
sample.
This includes GIMP version information, performance-log parameters (such as the
sampling rate), GEGL configuration parameters (such as the tile size), and the
values of all environment variables starting with GIMP_, GEGL_, or BABL_.
Viewing Performance Logs
The GIMP source tree includes a graphical viewer for performance logs, under
the tools/ directory.
The viewer is not included as part of GIMP installations, but is distributed as
part of source tarballs.
To view a performance log, run:
$GIMP_SRC_DIR/tools/performance-log-viewer $LOG_FILEwhere $GIMP_SRC_DIR is the root of the GIMP source tree, and $LOG_FILE is
the log filename.
Note that there is no need to build or install GIMP in order to use the log
viewer.
Indeed, only the files prefixed with performance-log in the tools/
directory are actually needed.
The log viewer does require, however, a POSIX-compatible shell, Python 3,
PyGObject, and GTK+ 3 (including gir bindings).
The rest of this section describes how to use the log viewer.
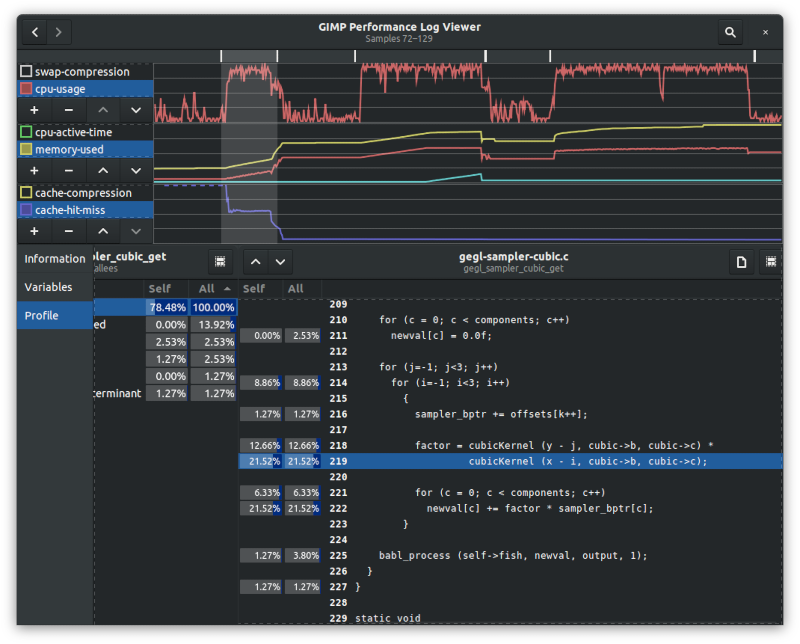
Sample-Selection Area
The upper part of the viewer window is the sample-selection area. It consists of one or more graphs, visualizing a selected subset of the instrumentation variables at each sample. A variable list to the left of each graph is used to select the set of variables to be visualized. The list is searchable by variable name, and its tooltip shows the variable descriptions. A row buttons below the list allows adding, removing, and reordering the graphs.
Note that all variables visualized by the same graph share the same scale.
It therefore makes sense to visualize variables that measure related
quantities, such as cache-occupied and swap-occupied, using a single graph,
while visualizing variables that measure unrelated quantities, such as
cache-occupied and cpu-usage, using separate graphs.
Boolean variables, such as cpu-active, are an exception, and always use the
full height of the graph, regardless of the other variables they are visualized
along.
A dashed line in a graph indicates that the corresponding variable’s value is infinite. A missing line in part of the graph indicates that a measurement of the corresponding variable is not available at the corresponding samples.
Event markers are displayed as ticks above the graphs, at the nearest sample.
Hovering over the sample-selection area displays a tooltip, showing the current sample index, the time at which it was taken relative to the start of the log, the values of all visualized variables at the current sample, and the descriptions for all event markers corresponding to the current sample, if any.
Selecting Samples
In addition to visualizing the instrumentation variables, the sample-selection area is used to select a subset of the samples, referred to as the current selection, which affects the data displayed in the information area, described below. The samples included in the current selection are highlighted on the graphs, and a textual description of the current selection appears in the window’s titlebar.
A single sample can be selected by clicking any of the graphs at the corresponding area. Multiple samples can be selected by clicking and dragging. Entire spans of samples enclosed between a pair of event markers can be selected by double-clicking, or double-clicking and dragging. Shift, Ctrl, and Shift+Ctrl can be used as modifiers in order to add-to, subtract-from, and intersect-with the current selection, respectively.
Samples can also be selected using the keyboard, with the arrow, Home/End, and Shift keys, while any of the graphs has focus.
Right-clicking on any of the graphs, or pressing Escape while they have focus, clears the selection. The behavior when the selection is empty is equivalent to selecting all samples.
Ctrl-right-clicking on any of the graphs inverts the selection.
Information Area
The lower part of the viewer window is the information area. It consists of multiple pages showing different data, generally relating to the current selection of samples.
Information Page
The information page shows global information contained in the log, not associated with any sample, including:
-
Log Parameters: Various parameters relating to the performance log itself. See section 1.2 for more information.
-
GIMP Version: Verbose GIMP version information, as reported by
gimp -v. -
Environment: A list of environment variables for the GIMP process recording the log, starting with
GIMP_,GEGL_, orBABL_. These environment variables directly affect the behavior of GIMP. -
GEGL Config: A list of all the properties of the
GeglConfigobject of the GIMP process recording the log.
The key/value lists are searchable by key name.
Markers Page
The markers page lists the event markers contained in the log, displaying their number, relative time, and description. It is only present in logs containing event markers.
If the current selection contains samples corresponding to any markers, the markers are selected in the markers-page list. Conversely, if any markers are selected in the markers-page list, the corresponding samples are selected.
Variables Page
The variables page shows instrumentation-variable statistics for the current selection.
When a single sample is selected, the current values of all variables are listed, both in a formatted form, and in raw form as appears in the log file. The formatted form is usually more convenient, while the raw form is more precise.
When multiple samples are selected, a number of statistics are listed for each variables, taken over the selected set of samples. This includes the minimum, maximum, and median values, the mean, and the standard deviation.
The variable list is searchable by variable name, and its tooltip shows the variable descriptions.
Backtrace Page
The backtrace page shows the program backtrace at the current sample. It is only available when a single sample is selected, in logs containing backtraces.
Threads Pane
The threads pane, on the left side of the page, lists all active threads at the time of the sample, displaying the following information:
-
ID: The operating-system numeric thread-ID, uniquely identifying the thread.
-
Name: The descriptive thread name. Note that not all threads may be named, or the name may not be available on some platforms.
-
State: The thread’s state. May be one of:
-
R: The thread is in a running state, executing code on the CPU. -
S: The thread is in a sleeping state, not executing any code. This may include various types of non-running states on different platforms.
Note that on some platforms, thread state information may not be fully accurate.
-
The thread list is searchable by thread name.
Double-clicking on a thread selects all samples at which the thread is in the running state.
Stack Pane
The stack pane, on the right side of the page, shows the selected thread’s call stack at the time of the sample, displaying the following information:
-
Frame Number (#): The stack-frame’s nesting level, where 0 is the most-nested frame.
-
Address: The start address of the function.
-
Object: The object file containing the function. The full path is available in the corresponding tooltip.
-
Function: The function name.
-
Offset: The offset of the current instruction, relative to the start of the function.
-
Source: The source file corresponding to the current instruction. The full path is available in the corresponding tooltip.
-
Line: The line number corresponding to the current instruction.
Note that for some frames, only partial information may be available.
When the source file for a given frame is found locally, a file icon is shown at the end of the corresponding row. The icon’s tooltip shows the local path to the source file, and clicking on the icon opens the file in a text editor, at the corresponding line (when possible). See section 4.5 for information regarding how to control local source-file lookup and the selected text editor.
The frame list is searchable by function name.
Double-clicking on a frame selects all samples at which the corresponding function is present in the backtrace.
Profile Page
The profile page shows a fully context-sensitive call graph, annotated with frequency information, for the current selection. It replaces the backtrace page when multiple samples are selected, in logs containing backtraces.
The call graph is comprised of all the call stacks at the selected samples. Note that each sample generally includes multiple call stacks—one per each thread. Some call stacks may be filtered out, as described below.
The call graph is traversed using a series of cascading columns (aka Miller columns). Each non-root column lists the direct descendants (callers or callees) of a given function; selecting a descendant opens a new column to the right of the current column, showing the descendants of the selected function, and so on.
Root Column
The root column of the call graph shows a list of all functions included in the graph. The following frequency statistics are shown next to each function:
-
Self: The number of call stacks in which the function appears at the most-nested frame (when the graph direction is caller → callee), or at the least-nested frame (when the graph direction is callee → caller), as a percentage of the total number of call stacks. When the graph direction is caller → callee, this quantity indicates the relative amount of time spent executing code belonging exclusively to this function.
-
All: The number of call stacks in which the function appears at any frame, as a percentage of the total number of call stacks. This quantity indicates the relative amount of time spent executing code belonging to this function, or any of its (direct or indirect) descendant, and is always greater-than or equal-to Self.
By default, the list is sorted by All, but it can be sorted by Self or by function name as well. The list is searchable by function name. Pressing Escape while the list has focus deselects the current item.
The root-column header buttons allow controlling the structure of the call graph:
Thread Filter
The Threads button opens the thread filter, allowing control over which threads, and which states of each thread, are included in the graph.
The thread filter lists all threads included in the current selection. Each thread is identified by ID and name, as described in section 4.2.4.1. Next to each thread is a row of toggles, corresponding to the different thread states; only call stacks during which the thread was in one of the active states are included in the graph. Clicking on a thread-state column title toggles the entire column.
The thread list can be searched by thread name.
Call-Graph Direction
By default, the graph direction is caller → callee—the direct descendants of each function are its callees. The Call-Graph Direction button allows toggling the graph between the caller → callee direction, and the reverse callee → caller direction, in which the direct descendants of each function are its callers.
Function Columns
When a function from the root column is selected, a new function column opens to the right of the root column, listing the direct descendants of the function. The descendants list has a similar structure to the function list of the root column. When a descendant function is selected, a subsequent function column opens to the right of current column, showing its direct descendants, and so on. In this manner, the call graph can be traversed according to its current direction.
Note that the call graph is fully context-sensitive. This means that the listed descendants of the function depend on the current column’s path in the graph, that is, on the call chain leading to the column.
For example, suppose functions foo1 and foo2 both call bar, which, in
turn, calls baz1 and baz2; however, bar only calls baz1 when called
through foo1, and baz2 when called through foo2.
When selecting foo1 in the root column, in the caller → callee direction,
and subsequently selecting bar in foo1’s column, bar’s column will only
list baz1 as a descendant, since baz2 is never called by bar when it is
called through foo1.
Likewise, when selecting foo2 in the root column, and bar in foo2’s
column, only baz2 will be listed in bar’s column.
Context-sensitivity extends to the frequency statistics as well: The only call stacks considered for each descendant are those in which it appears as part of a call chain matching the current column. In other words, the statistics are local to the current call chain, and are generally different from the global statistics for the same functions.
In addition to the function’s callees or callers, the descendants list includes a special [Self] item, corresponding to the current function. It is most useful for its Self percentage, which, in the caller → callee direction, indicates the amount of time spent executing code belonging exclusively to the current function, and not to any of its descendants, relative to the total amount of time spent executing the function as a whole. In other words, in non-recursive cases, the sum of [Self]’s Self percentage, and the rest of the descendants’ All percentage, adds up to 100%—the full execution time of the function.
Double-clicking on any of the descendants selects the corresponding function in the root column, effectively discarding the current call-chain context. It is especially useful before swapping the graph’s direction.
The Select Samples button in the column header selects all the samples corresponding to the current column, that is, all the samples whose call stacks contribute to column. The button’s tooltip shows a textual description of the samples.
Source Columns
When the [Self] item of a function column is selected, if the log contains source-location information for the function, and the corresponding source file is found locally, a new source column opens to the right of the function column, showing the source code for the function. Source lines which appear as part of call stacks display similar frequency statistics to the root- and function-columns, and are referred to as annotated lines. Similarly to descendants in function columns, annotated lines are also context-sensitive.
When a source column is opened, the annotated line with the highest All percentage is selected. The Previous Annotated Line and Next Annotated Line buttons on the left side of the column header can be used to quickly navigate between annotated lines. The source code is searchable by line number.
The Select Samples button in the column header selects all the samples corresponding to the selected annotated source line. The button’s tooltip shows a textual description of the samples.
The file button in the column header opens the source file in a text editor, at the selected line, if possible (see section 4.5). The button’s tooltip shows the full path to the file.
Selection Modifiers
The buttons on the right side of the window’s titlebar allow modifying the selection in various ways: The Clear Selection and Invert Selection buttons clear and invert the selection, respectively. The Find Samples button allows searching for samples, as explained below.
Searching Samples
The Find Samples button opens a popover allowing searching for all samples
matching a user-defined condition.
The condition should be a Python expression, evaluating to a boolean value.
The selected samples are those for which the expression evaluates to True.
A number of sample-dependent variables and functions are provided:
-
Instrumentation Variables: All instrumentation variables are available as variables of type
float. Hyphens in variable names are replaced with underscores.For example, the expression
cpu_usage > 0.5matches all samples at which thecpu-usagevariable is greater-than or equal-to 0.5, that is, at which CPU usage is above 50%. -
thread (id, state = None): Thethread()function matches all samples whose backtrace contains a given thread.The
idargument may be either a thread-ID of typeint, or a thread name of typestr. The argument may be a regular expression, which should fully match the thread name.The optional
stateargument, if notNone, may specify a thread state (see section 4.2.4.1). Only samples at which the thread is in the given state are matched. The argument may be a regular expression, which should fully match the thread state.For example, the expression
thread ('paint', 'R')matches all samples at which thepaintthread is in theR(running) state. -
function (name, id = None, state = None): Thefunction()function matches all samples whose backtrace contains a given function.The
nameargument should specify a function name. The argument may be a regular expression, which should fully match the function name.The optional
idandstatearguments have similar meaning to the corresponding arguments of thethread()function, and may be used to limit the search to the call stacks of matching threads.For example, the expression
function ('gimp_image_.*')matches all samples whose backtrace includes a function beginning withgimp_image_, that is, one of theGimpImagefunctions.
By default, the matching samples replace the current selection, but they can be set to add-to, subtract-from, or intersect-with the current selection instead.
History Navigation
The Back and Forward buttons on the left side of the window’s titlebar allow moving backward and forward in the viewer’s state history. The viewer state consists of the current selection, and the current call-graph direction, thread filter, and path.
Environment Variables
The following environment variables are used by the viewer:
-
PERFORMANCE_LOG_VIEWER_PATH: Colon-separated list of paths, under which to look for local source files. If the variable is not defined, the current directory is used instead.Source files appearing in the log are searched as follows, where the first matching file is selected:
-
If the path is absolute, look for the file at the exact location.
-
For each local path in
PERFORMANCE_LOG_VIEWER_PATH, try concatenating the local path and the log path. If no such file exists, remove the first component of log path, and try again.
-
-
PERFORMANCE_LOG_VIEWER_EDITOR: The command to use to launch the text editor. The special strings{file}and{line}are replaced with the filename and line number, respectively. If the variable is not defined, a default text editor is used.